One workspace.
Every workflow.
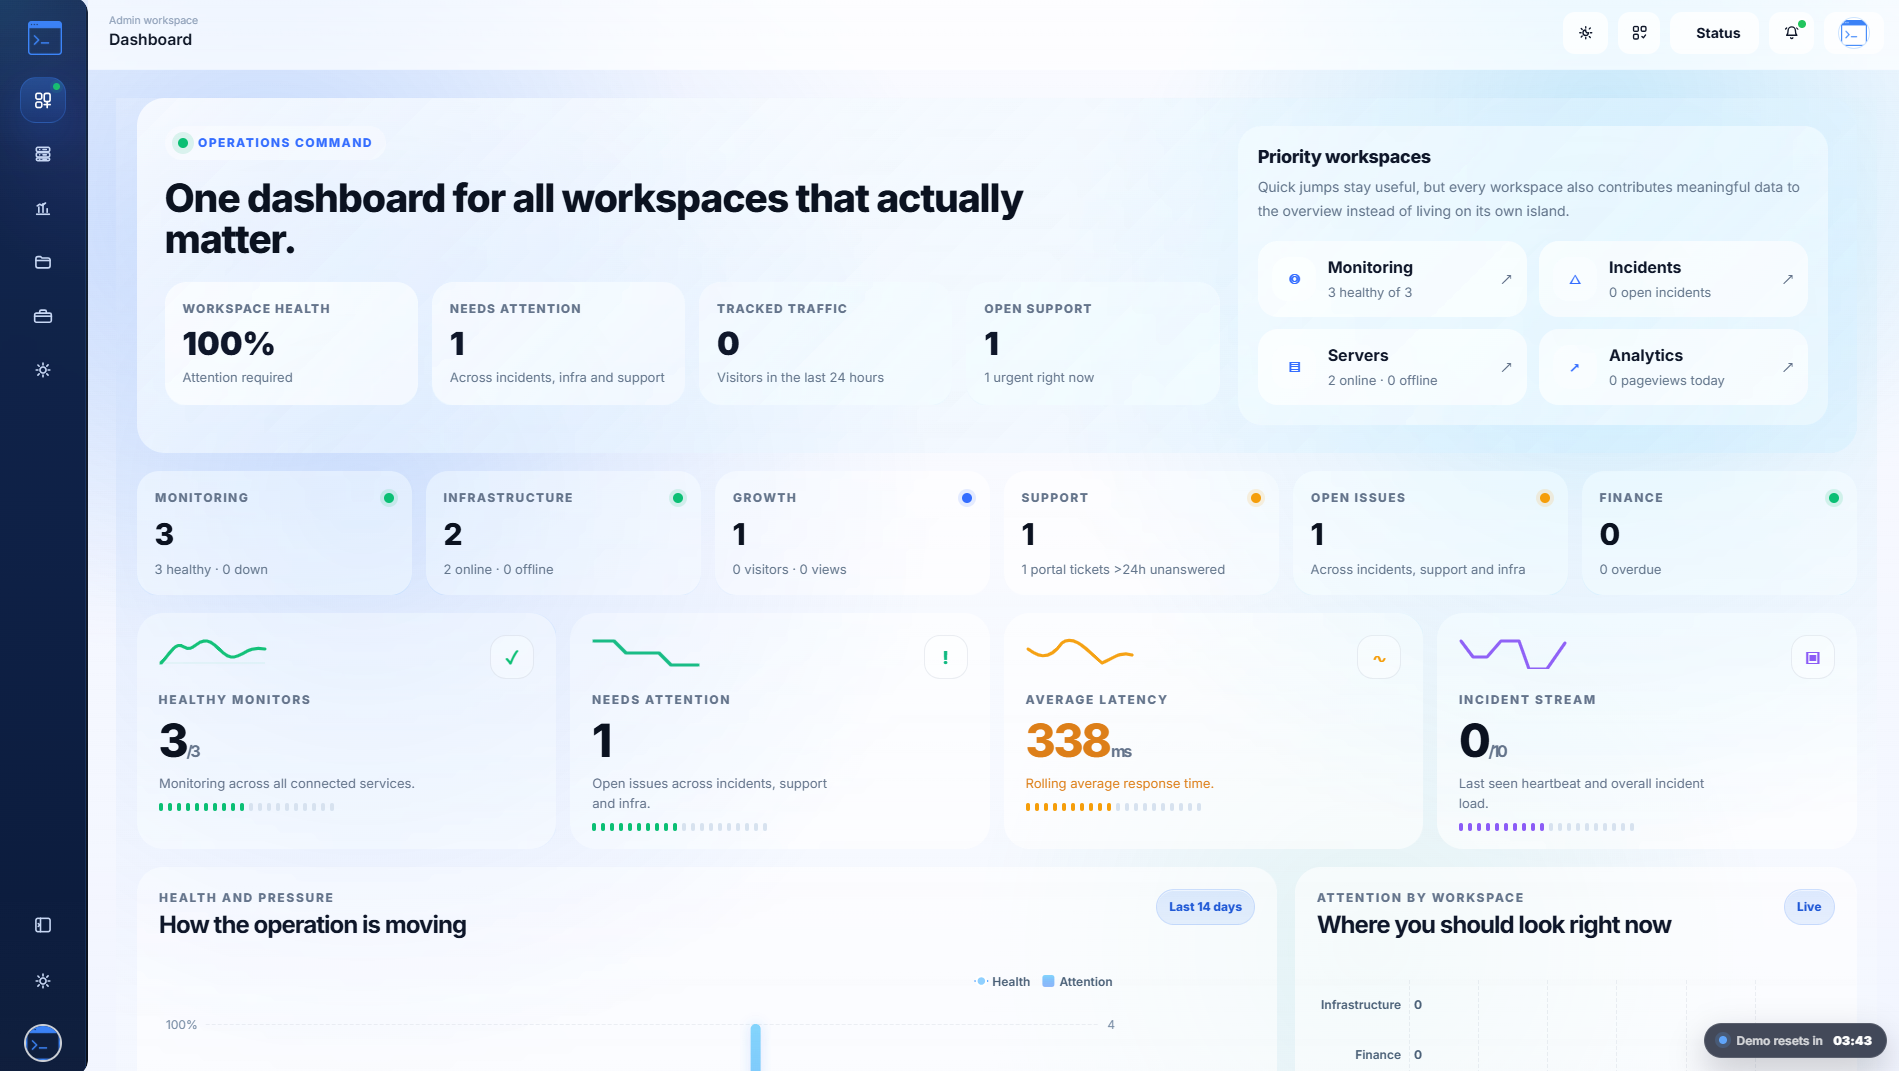
Monitor uptime, run analytics, deliver projects, and resolve tickets — all in one cinematic command center.
Monitor uptime, run analytics, deliver projects, and resolve tickets — all in one cinematic command center.
Monitor uptime, run analytics, deliver projects, and resolve tickets — all in one cinematic command center.
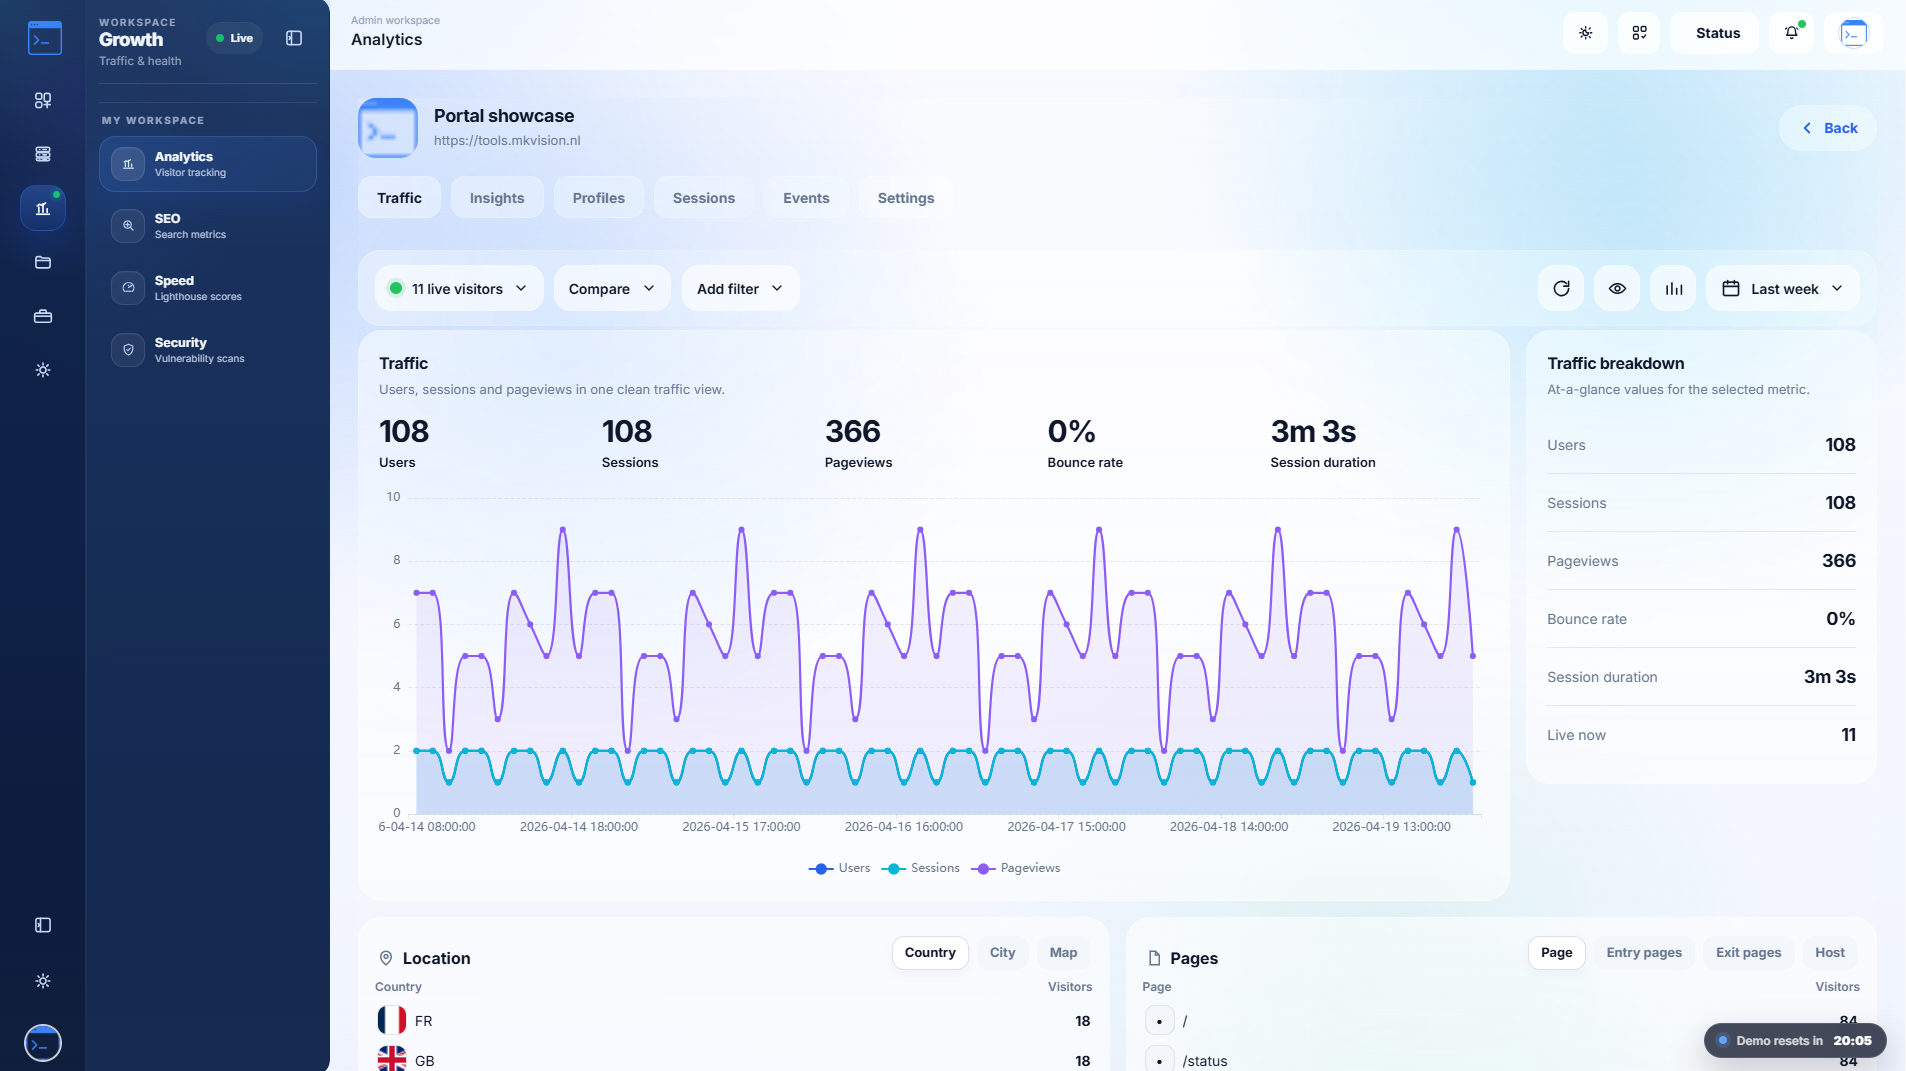
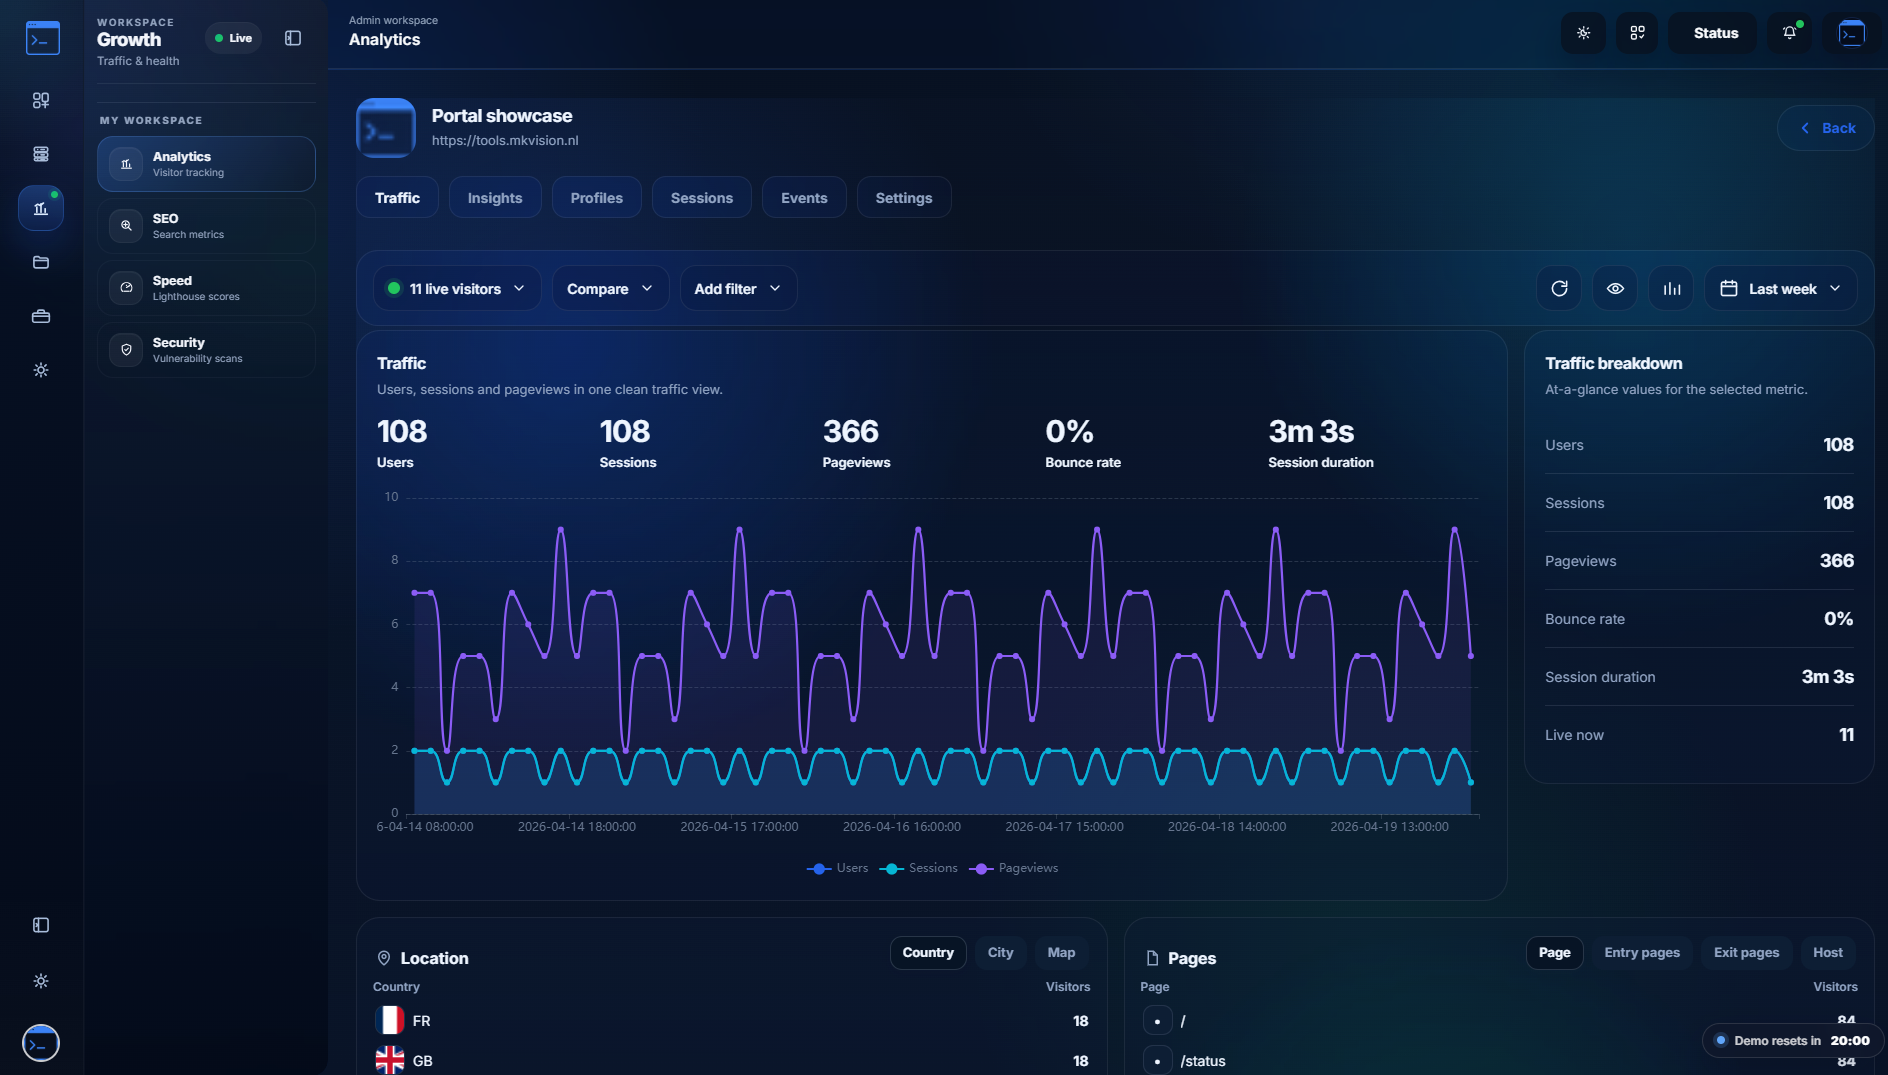
Privacy-friendly analytics turn raw visits into clear stories — live sessions, journeys, and conversions in one stream.
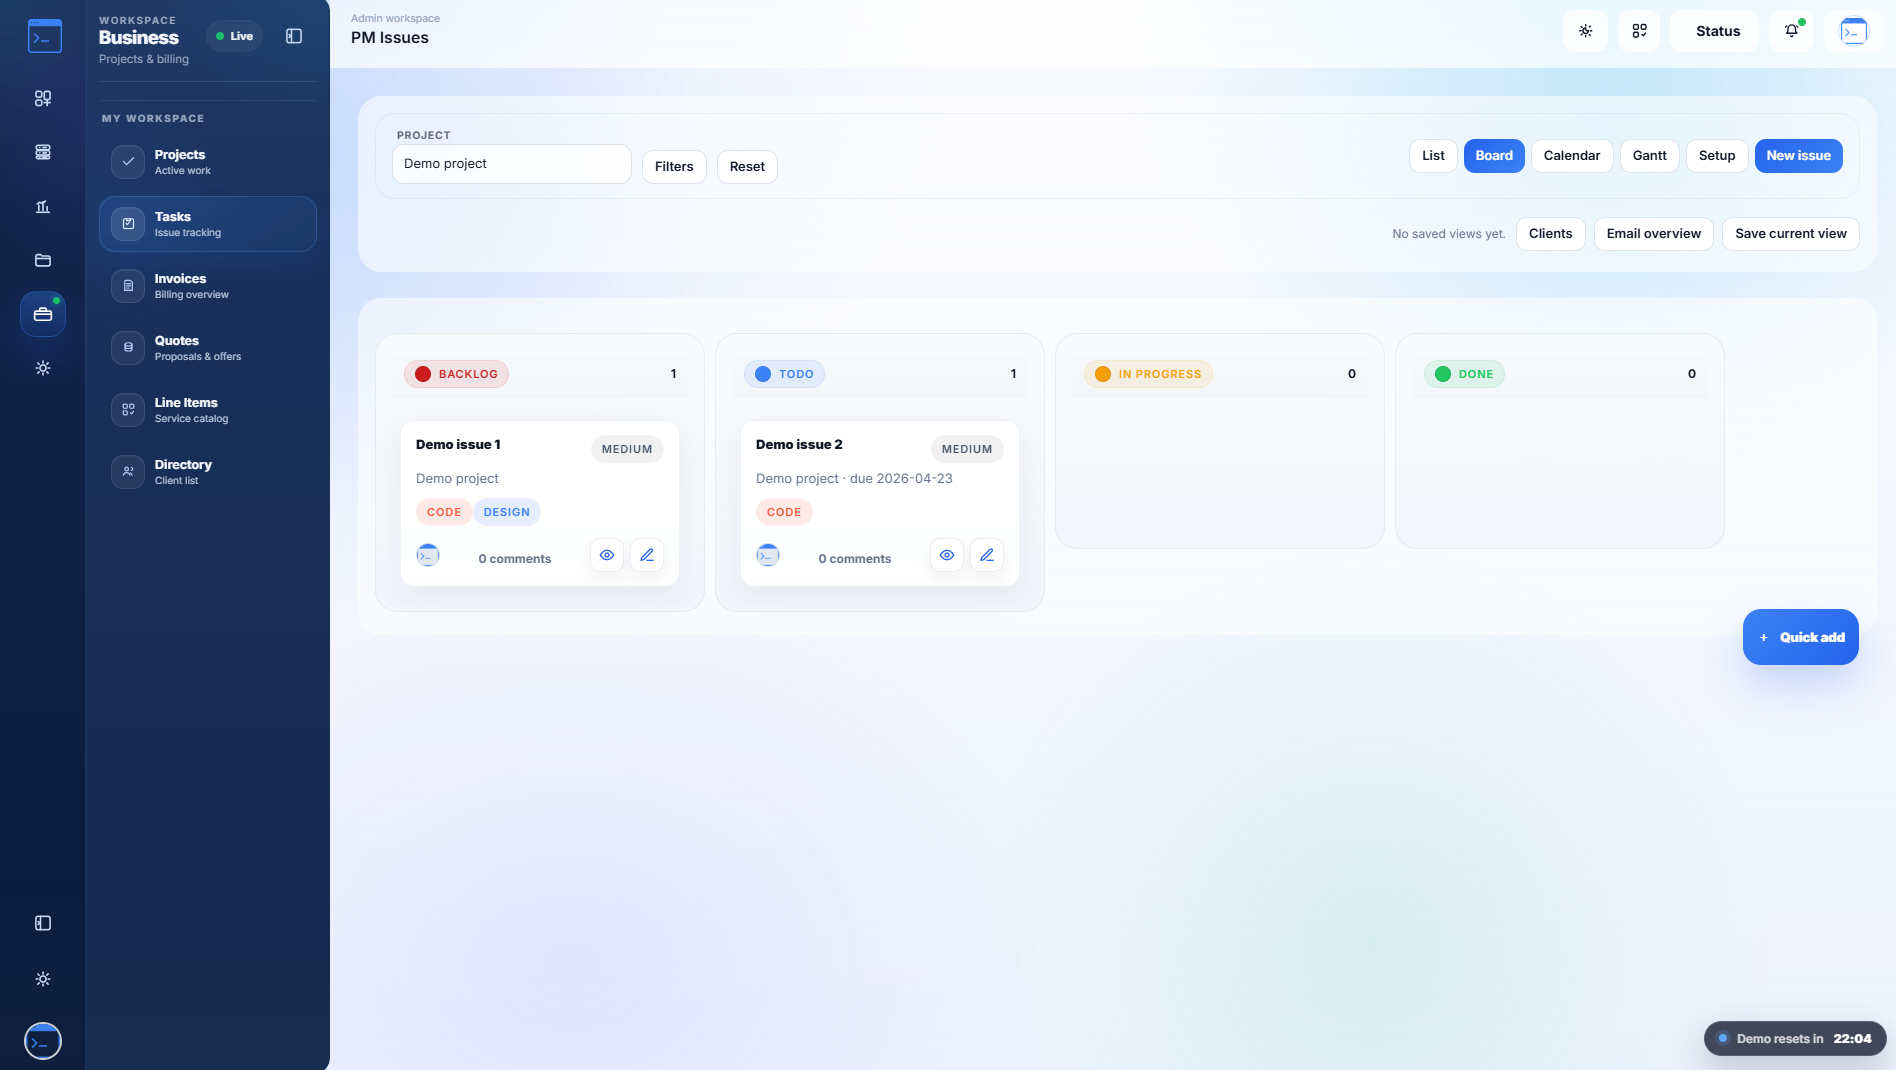
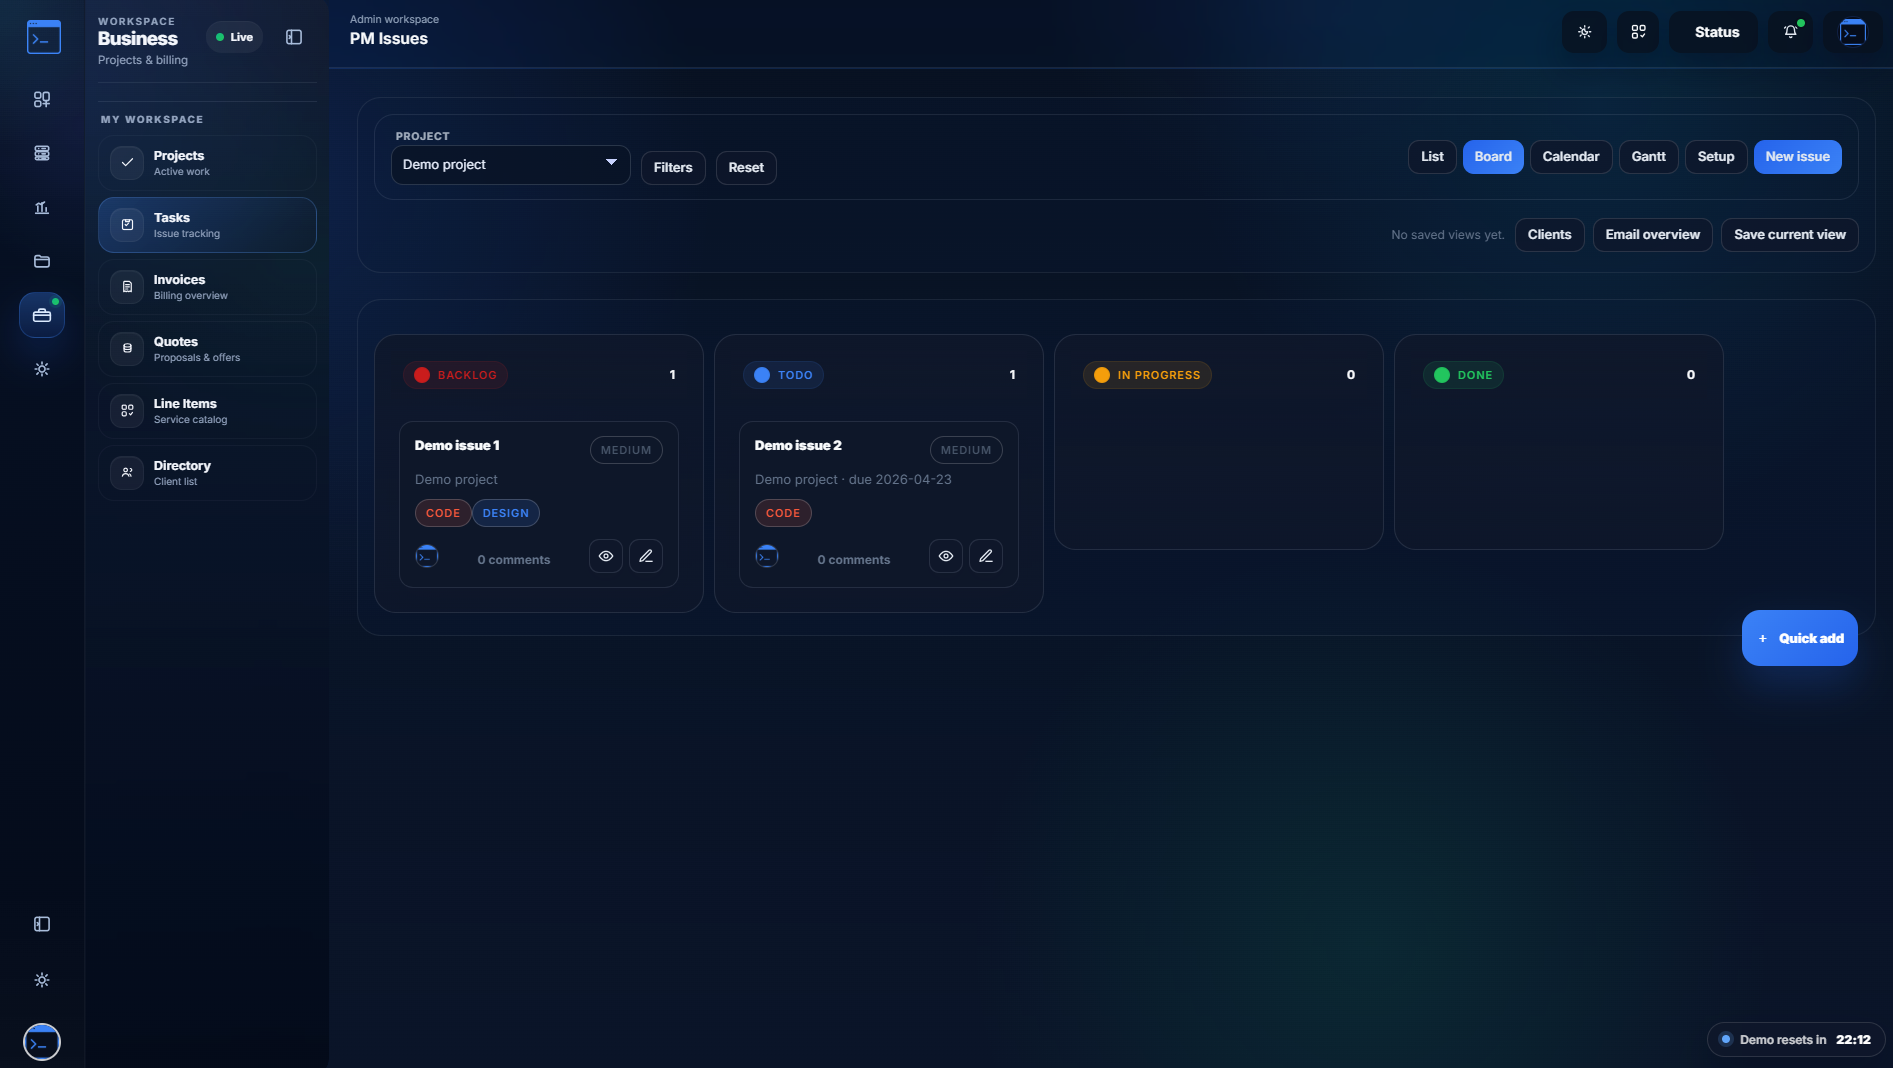
Connect issue boards, calendar views, and timeline planning into one continuous delivery thread your team actually enjoys.
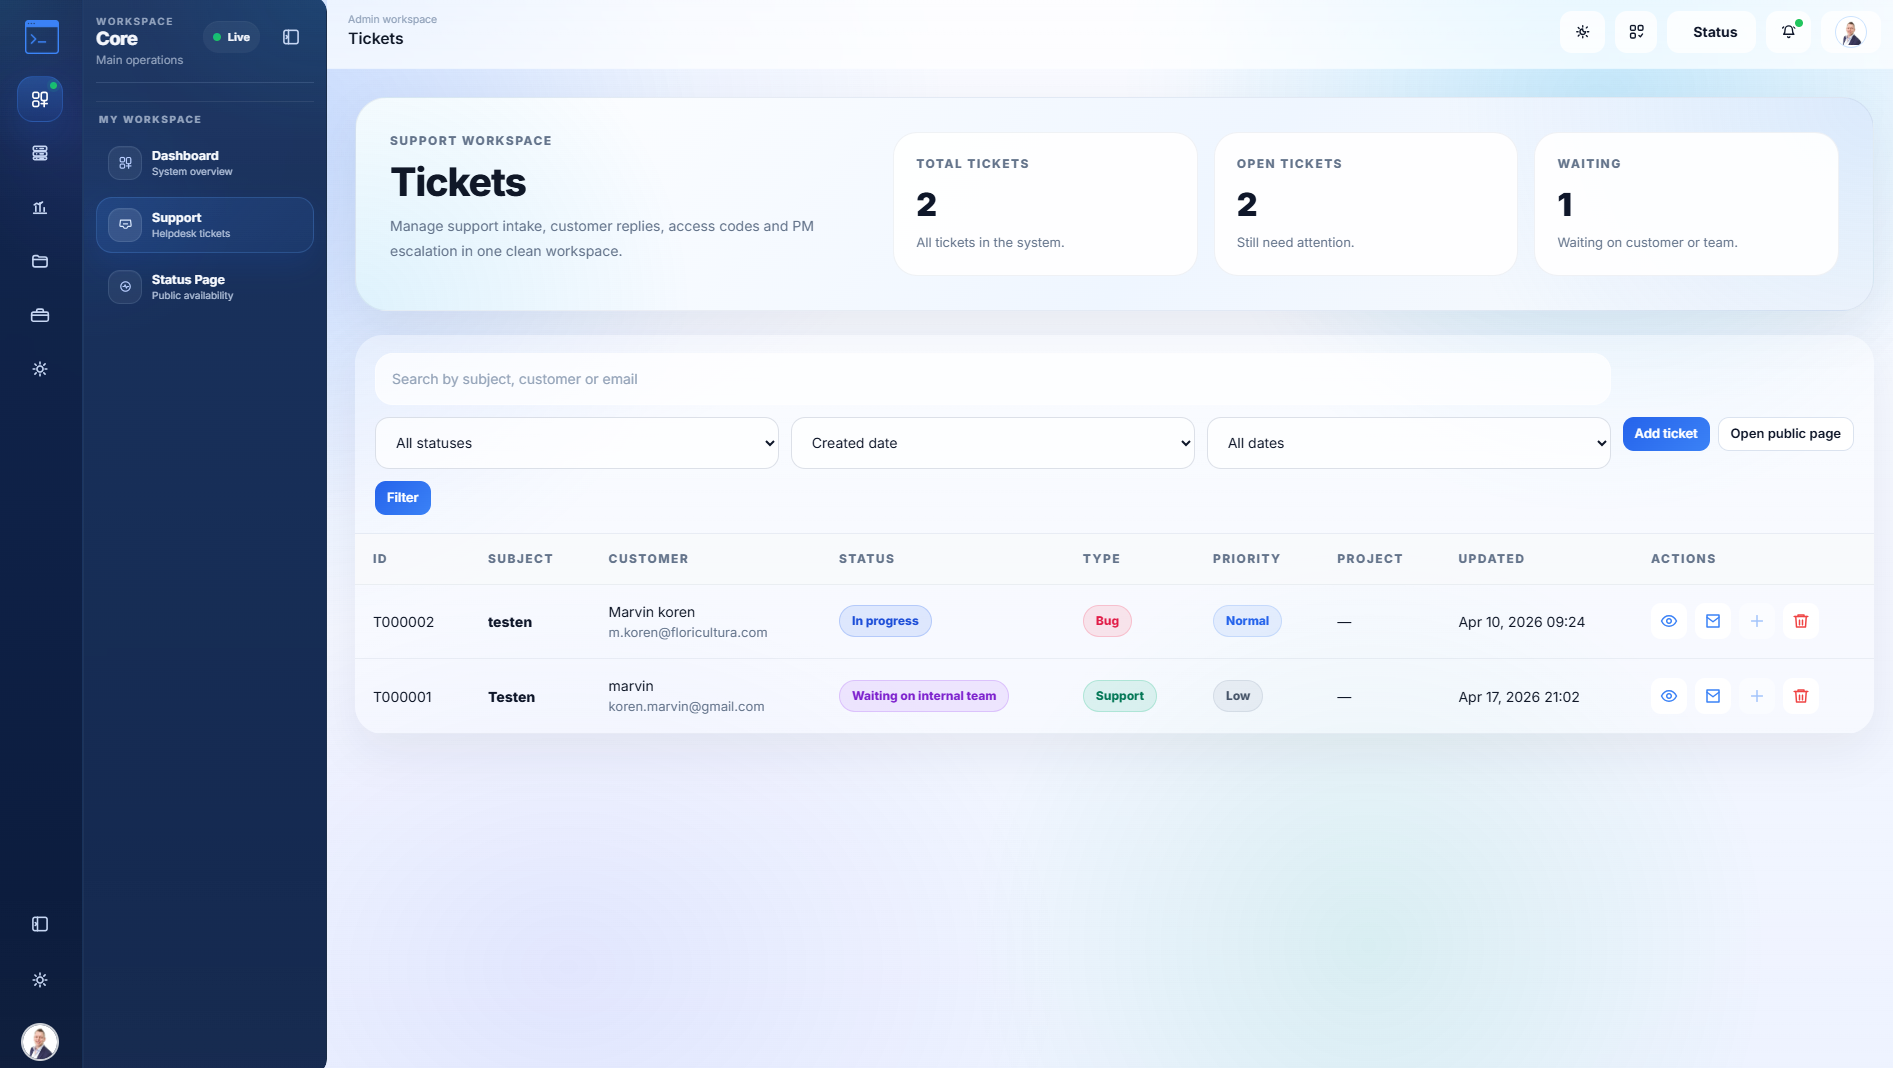
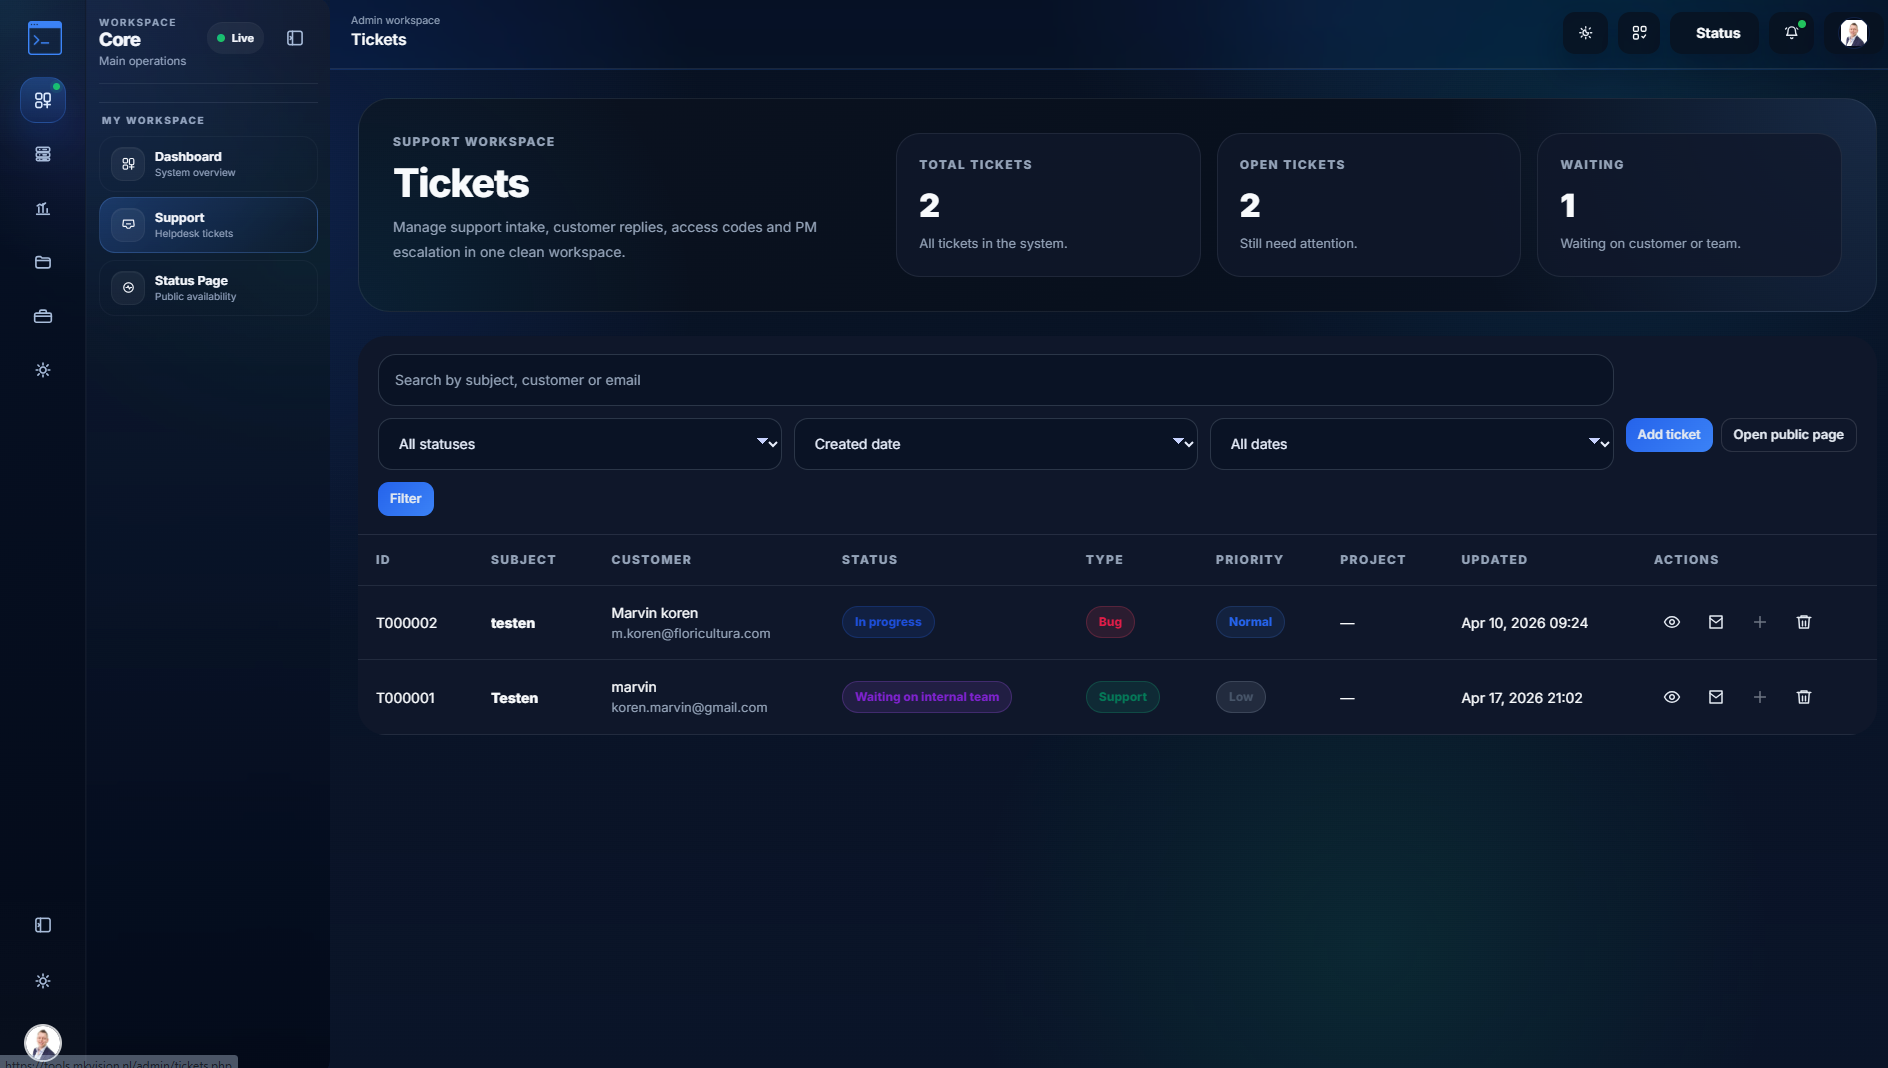
Tickets, priorities, and customer communication move with your team — never lost, never out of sync.
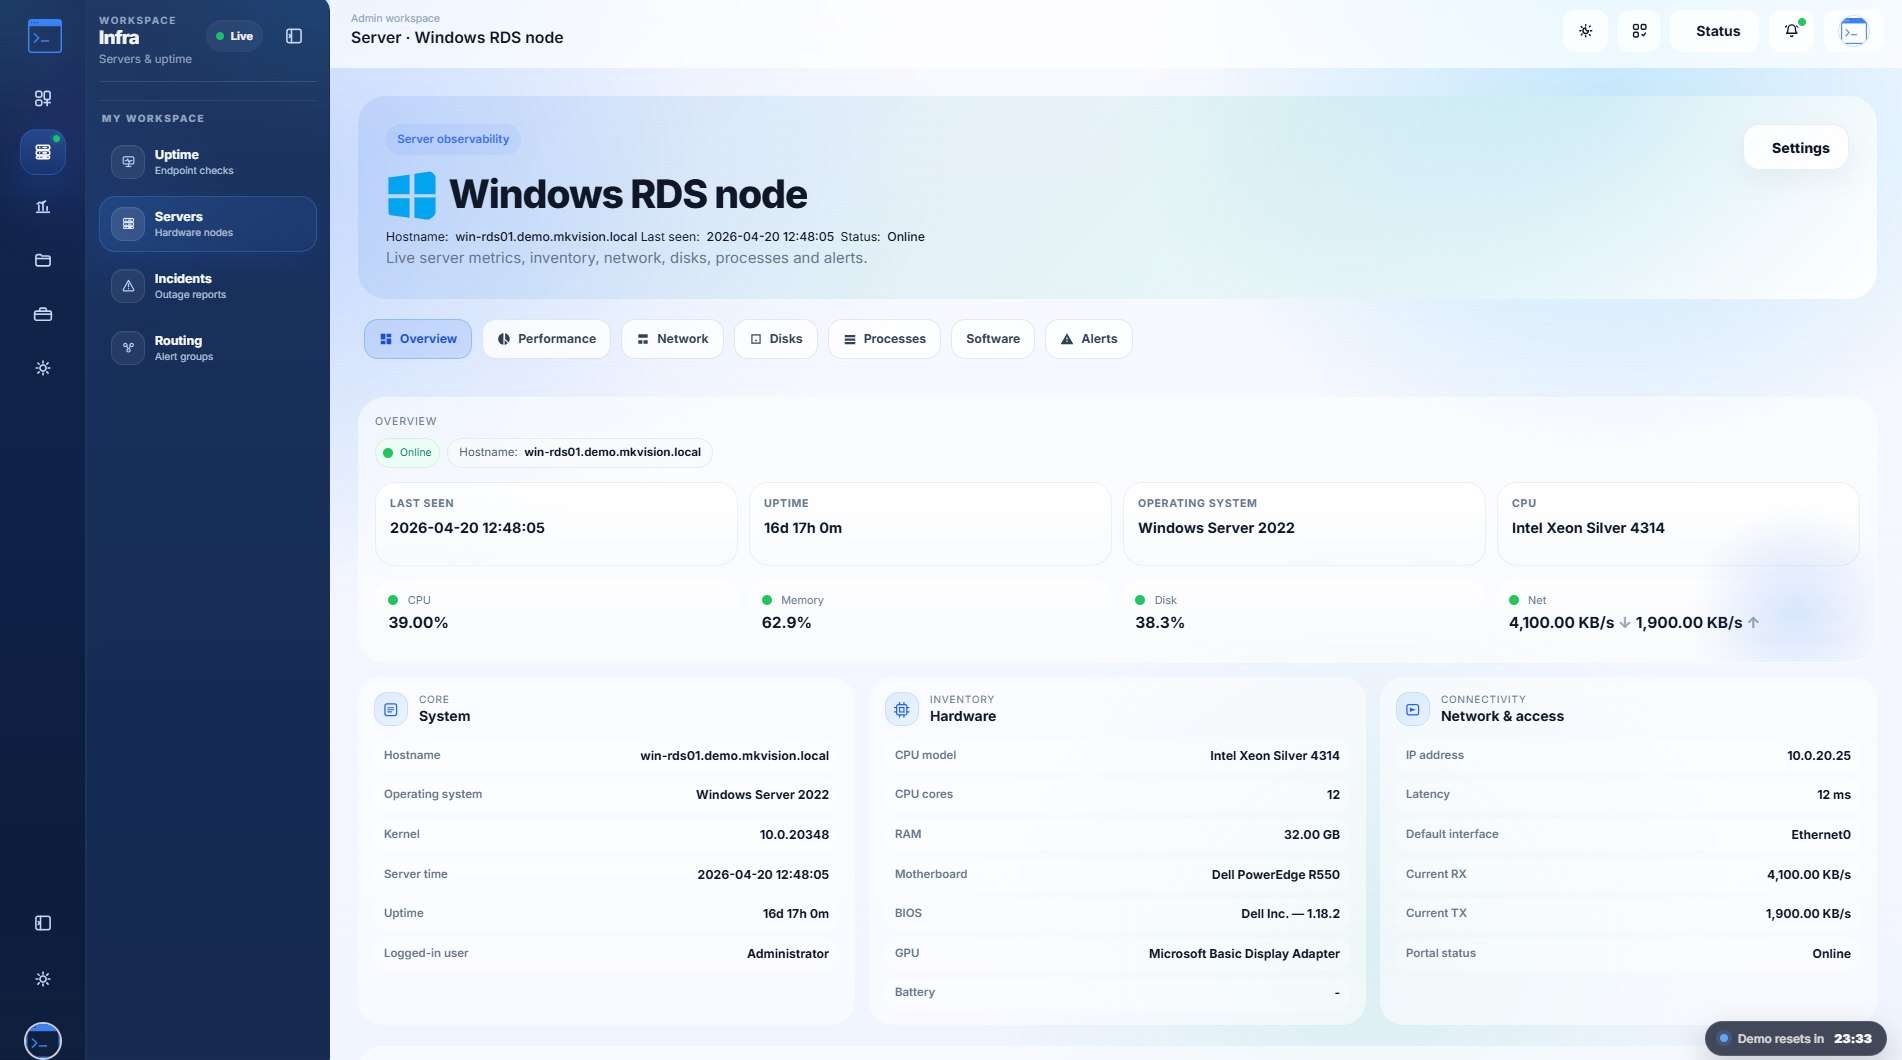
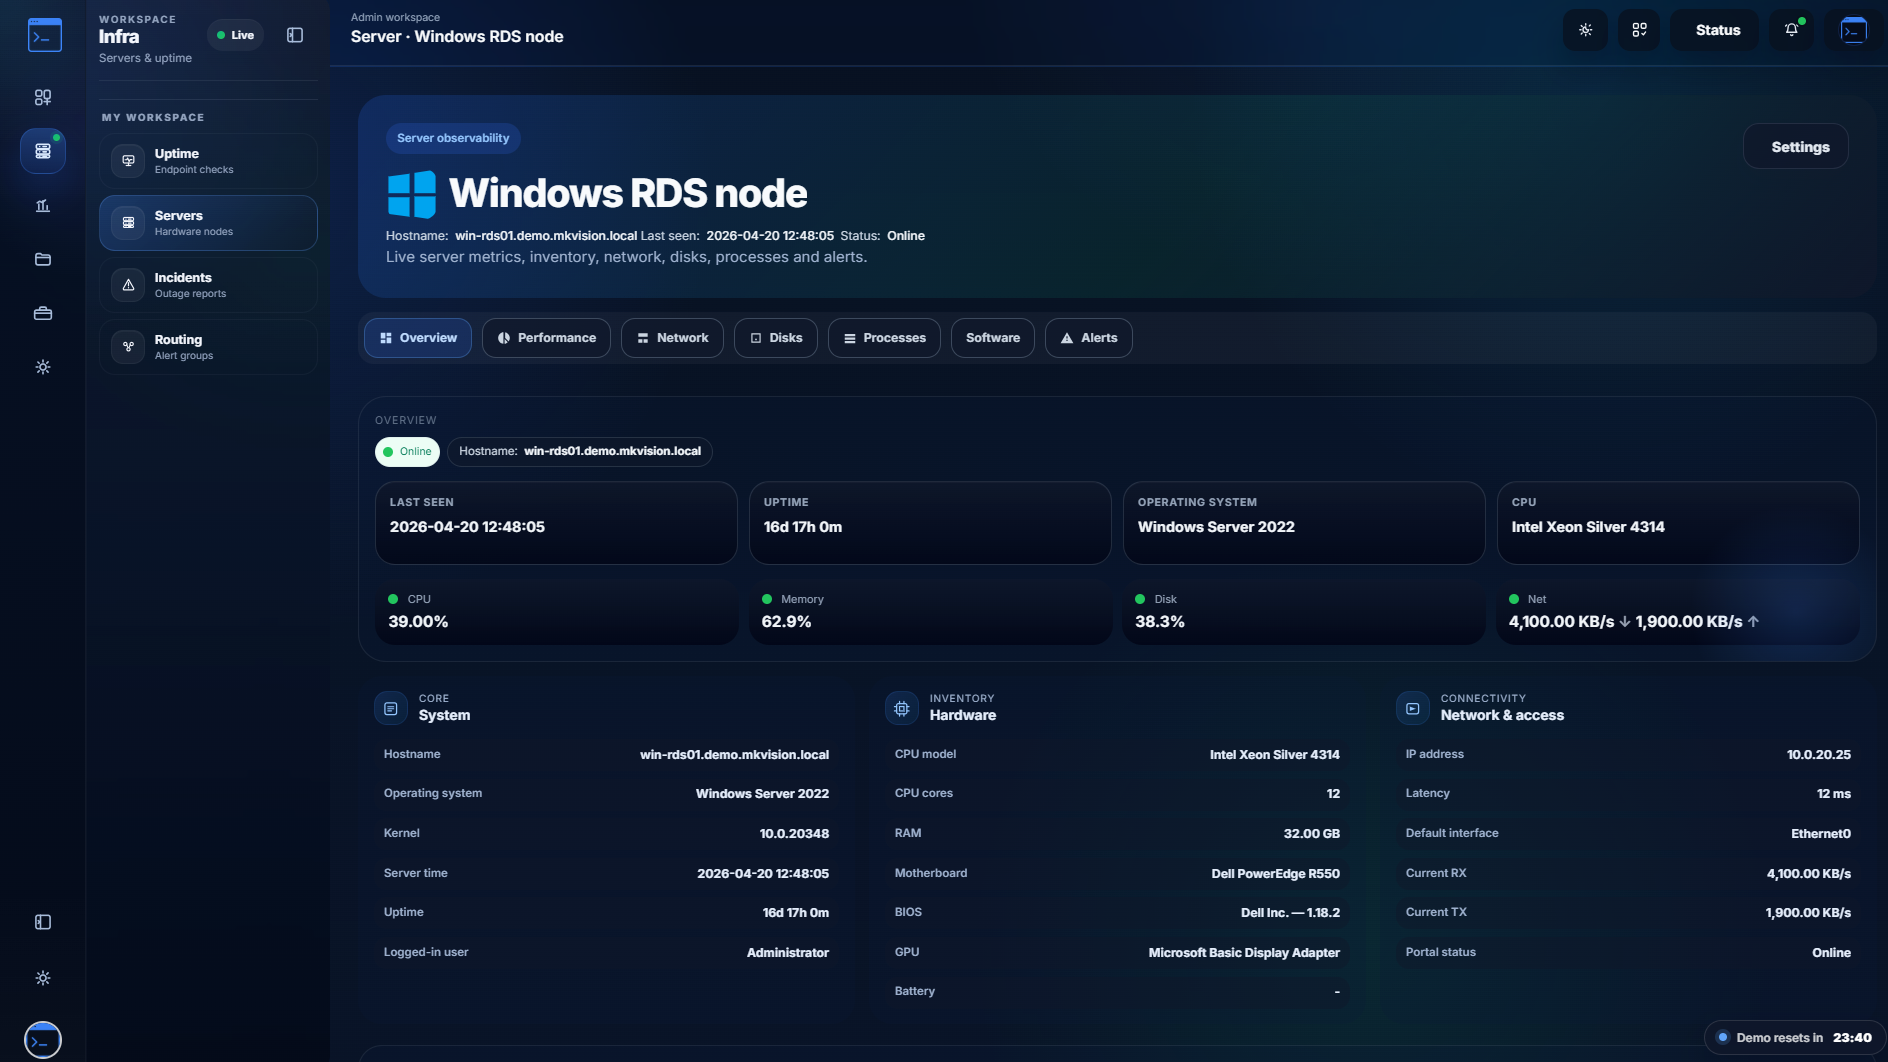
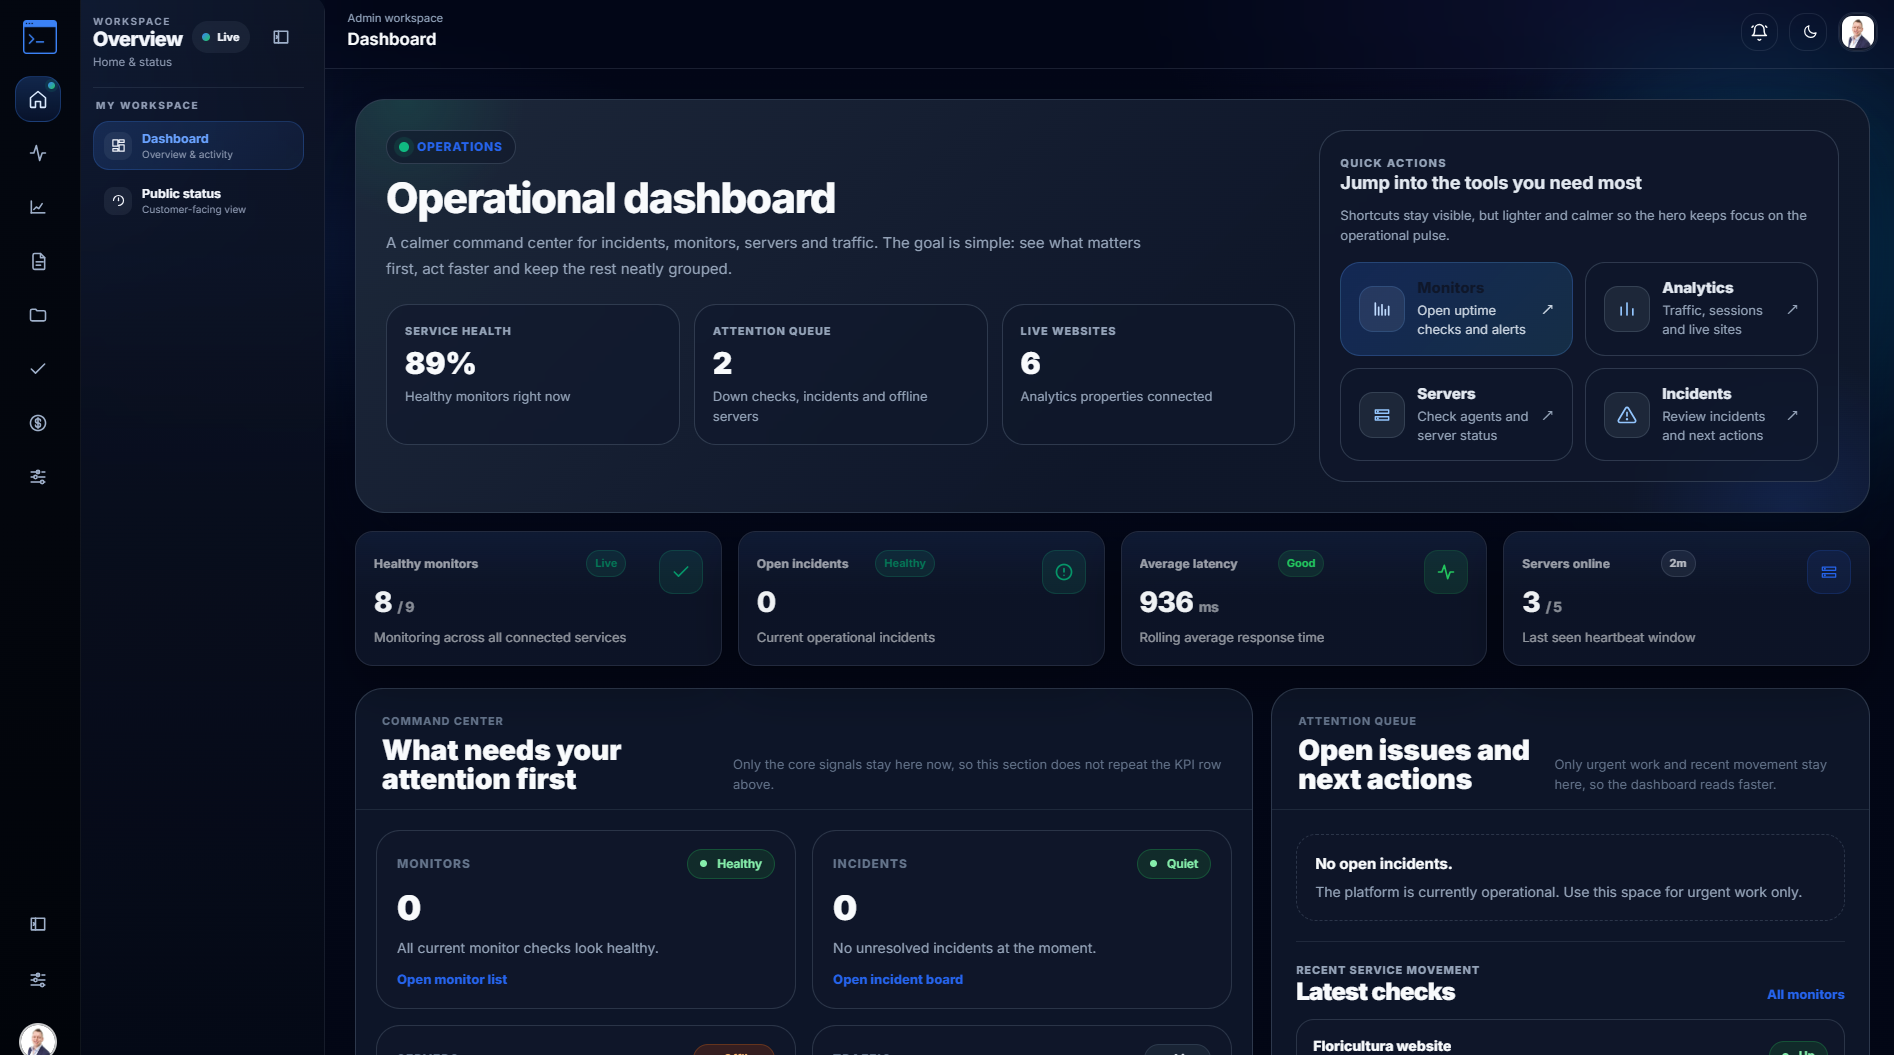
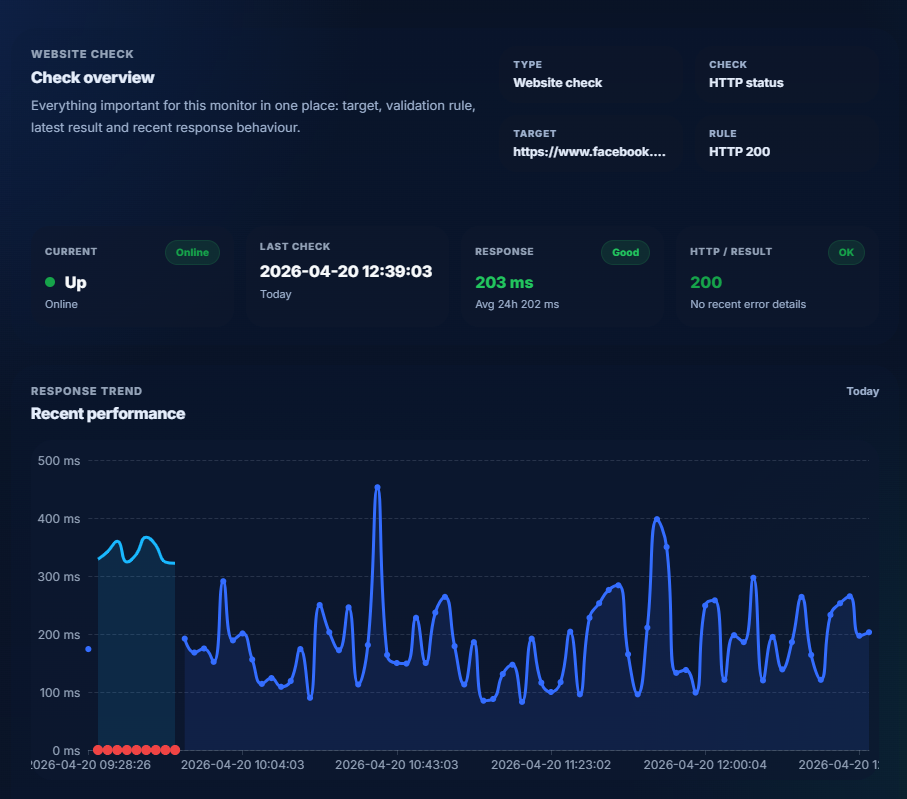
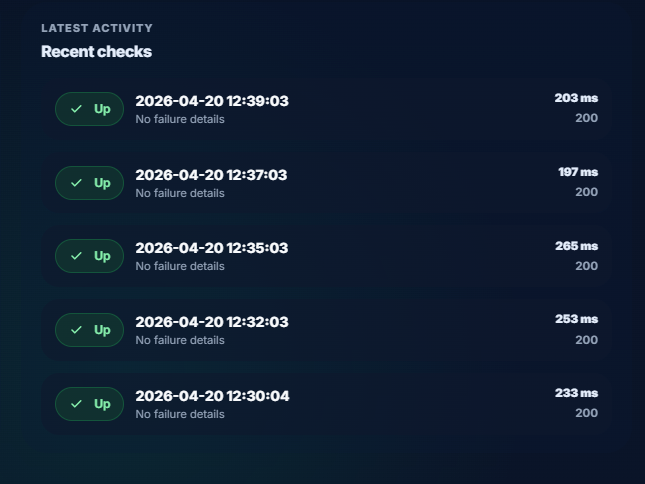
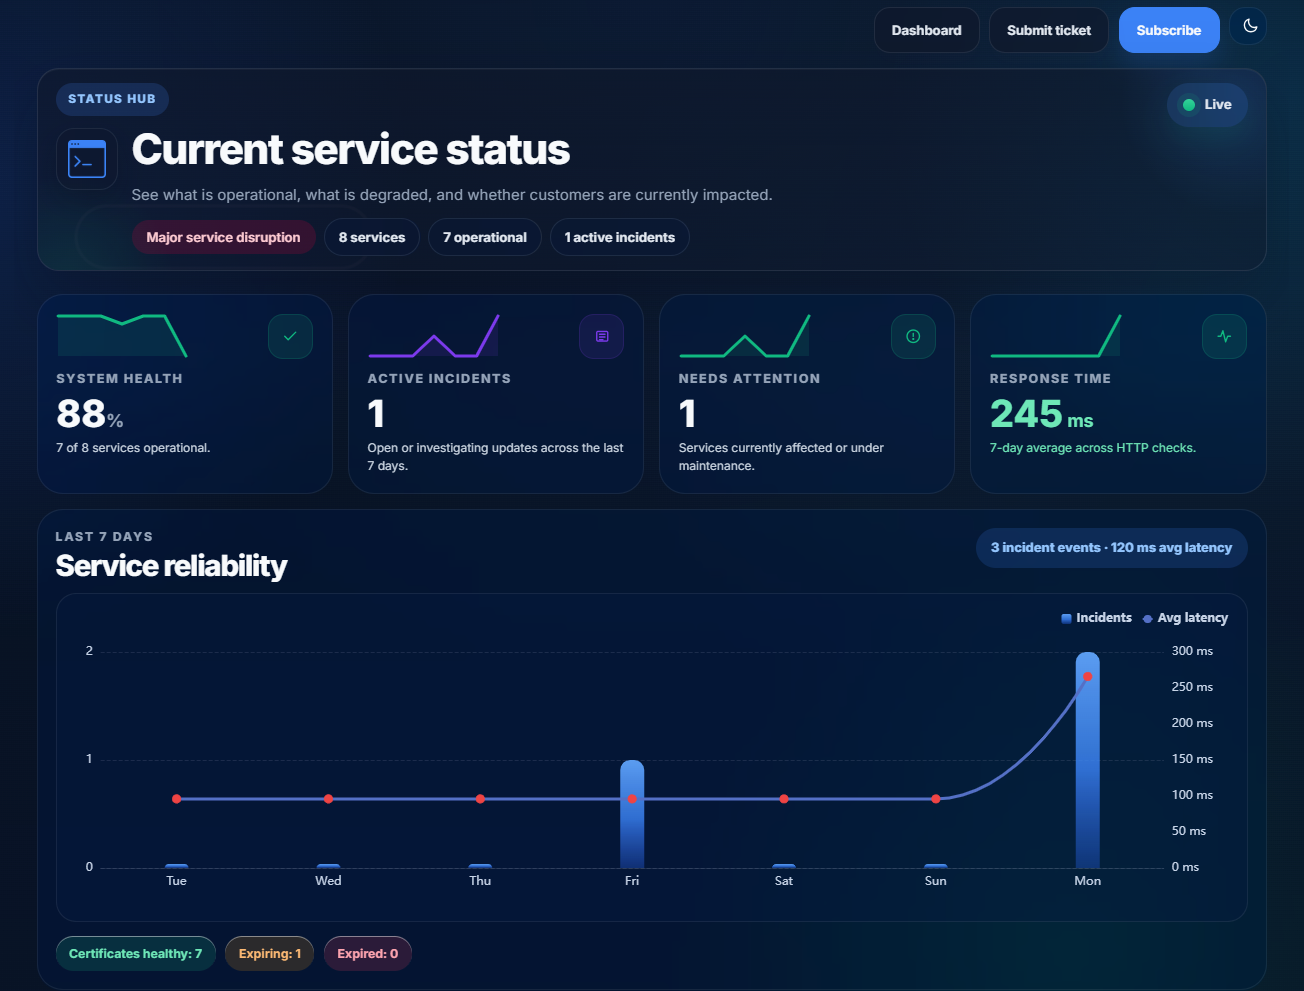
Monitoring, status pages, and server health close the loop. Your operation, observable in one cinematic view.
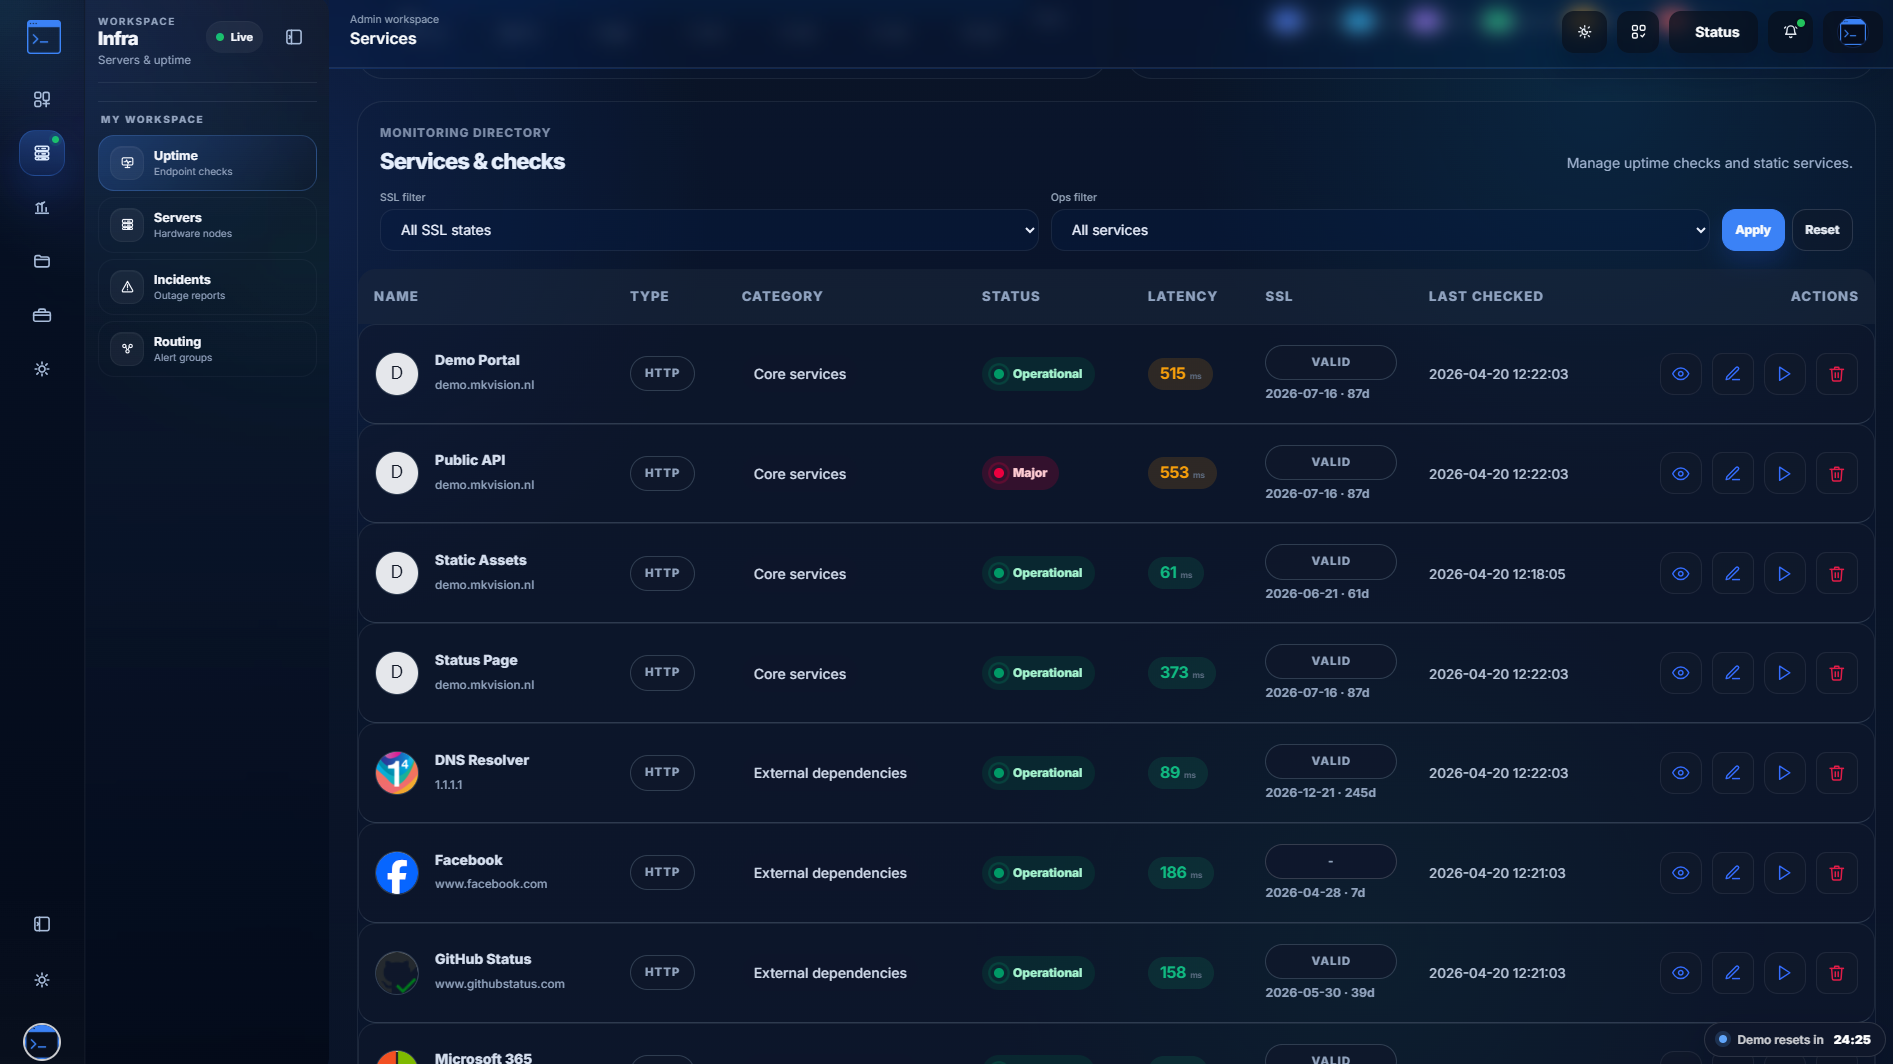
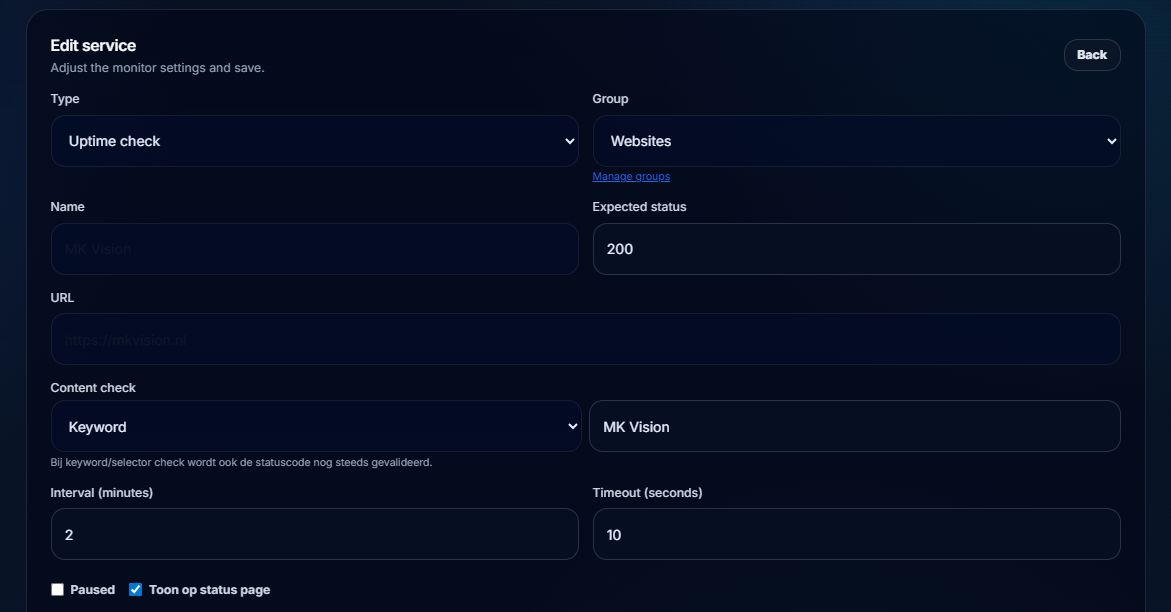
Run recurring checks, validate SSL certificates, and track response times. Publish selected services to a customer-facing PWA status page.
A powerful privacy-friendly analytics engine. Track visitors, sessions, screen resolutions, and profiles. Use custom date ranges.
Connect issue boards, calendar views, and timeline planning in one workspace. Send branded PM progress updates directly to clients.
Customers submit requests via a public portal, upload attachments, and log back in using secure 6-digit email codes.
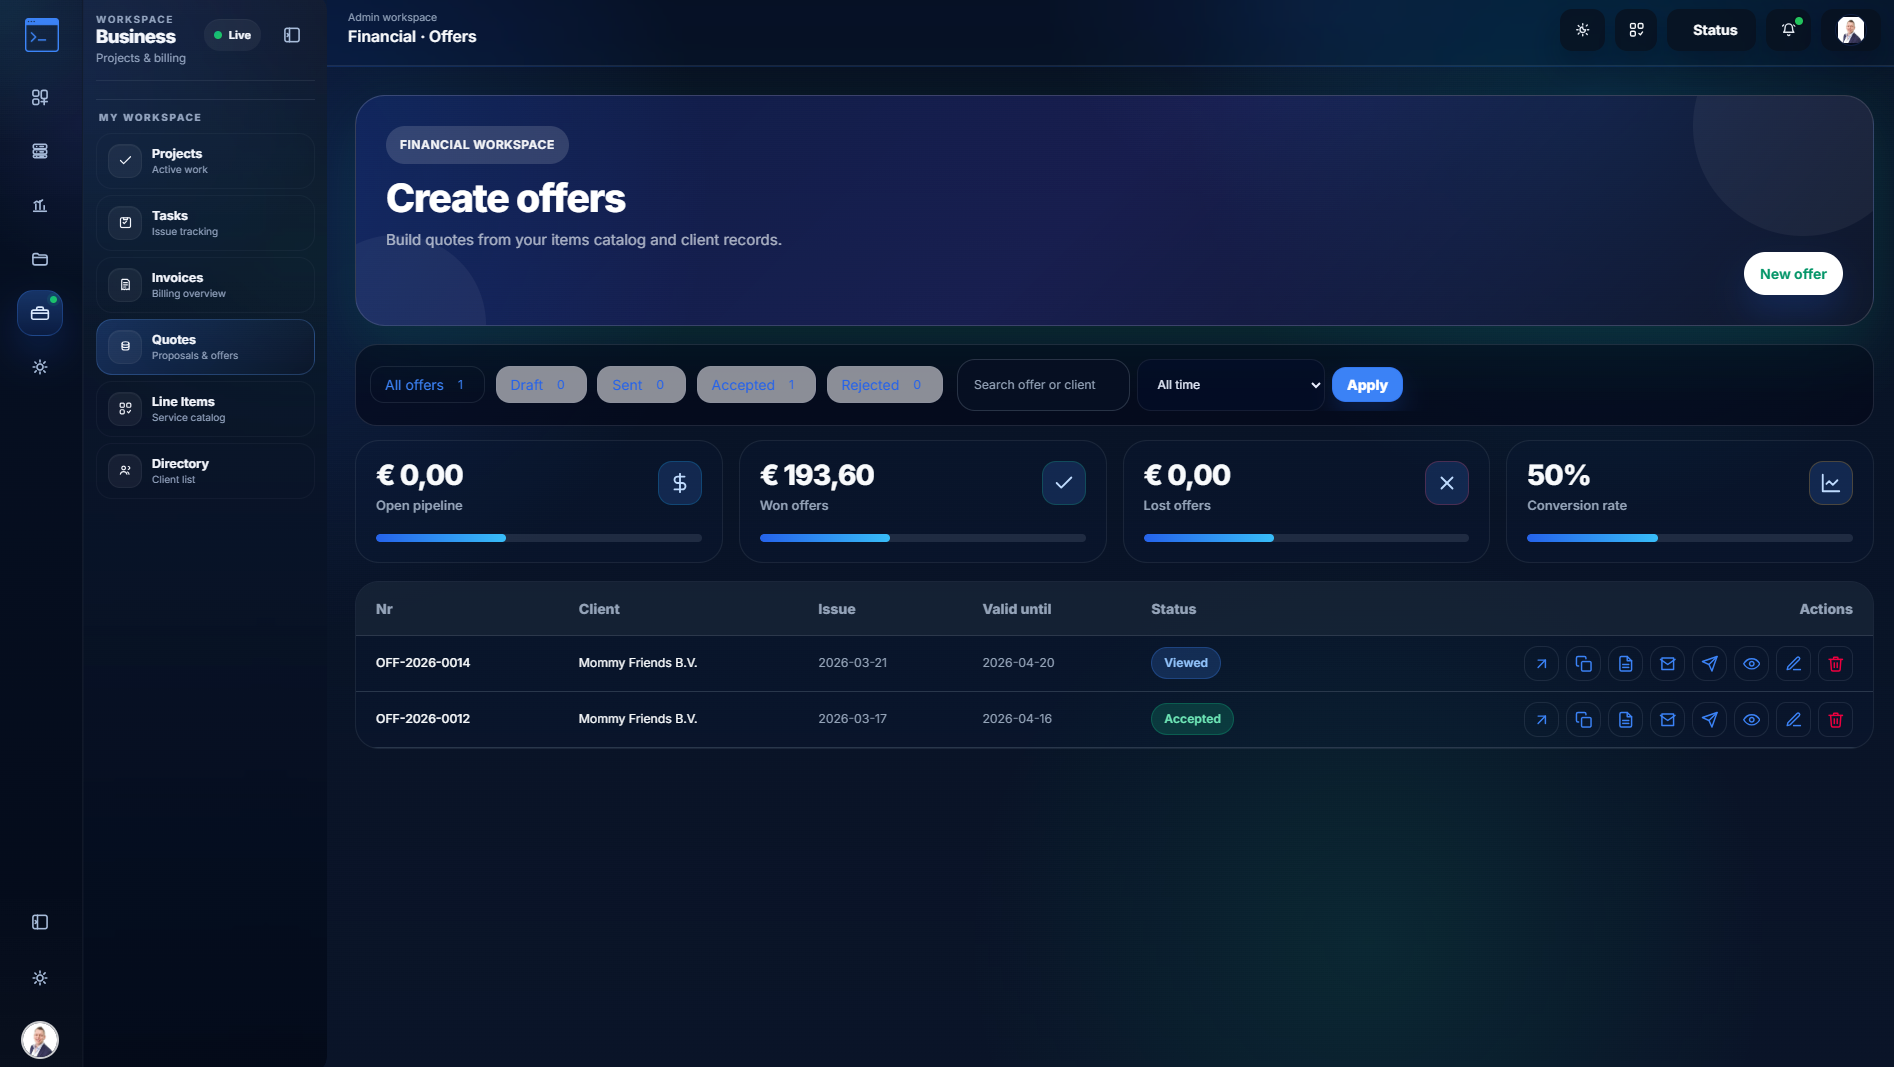
Create quotes with shared line items and VAT rules. Send secure links where clients review and sign digitally.
Install agents on Linux, macOS, or Windows to stream CPU, memory, disk, and per-core metrics. Secure the entire platform.
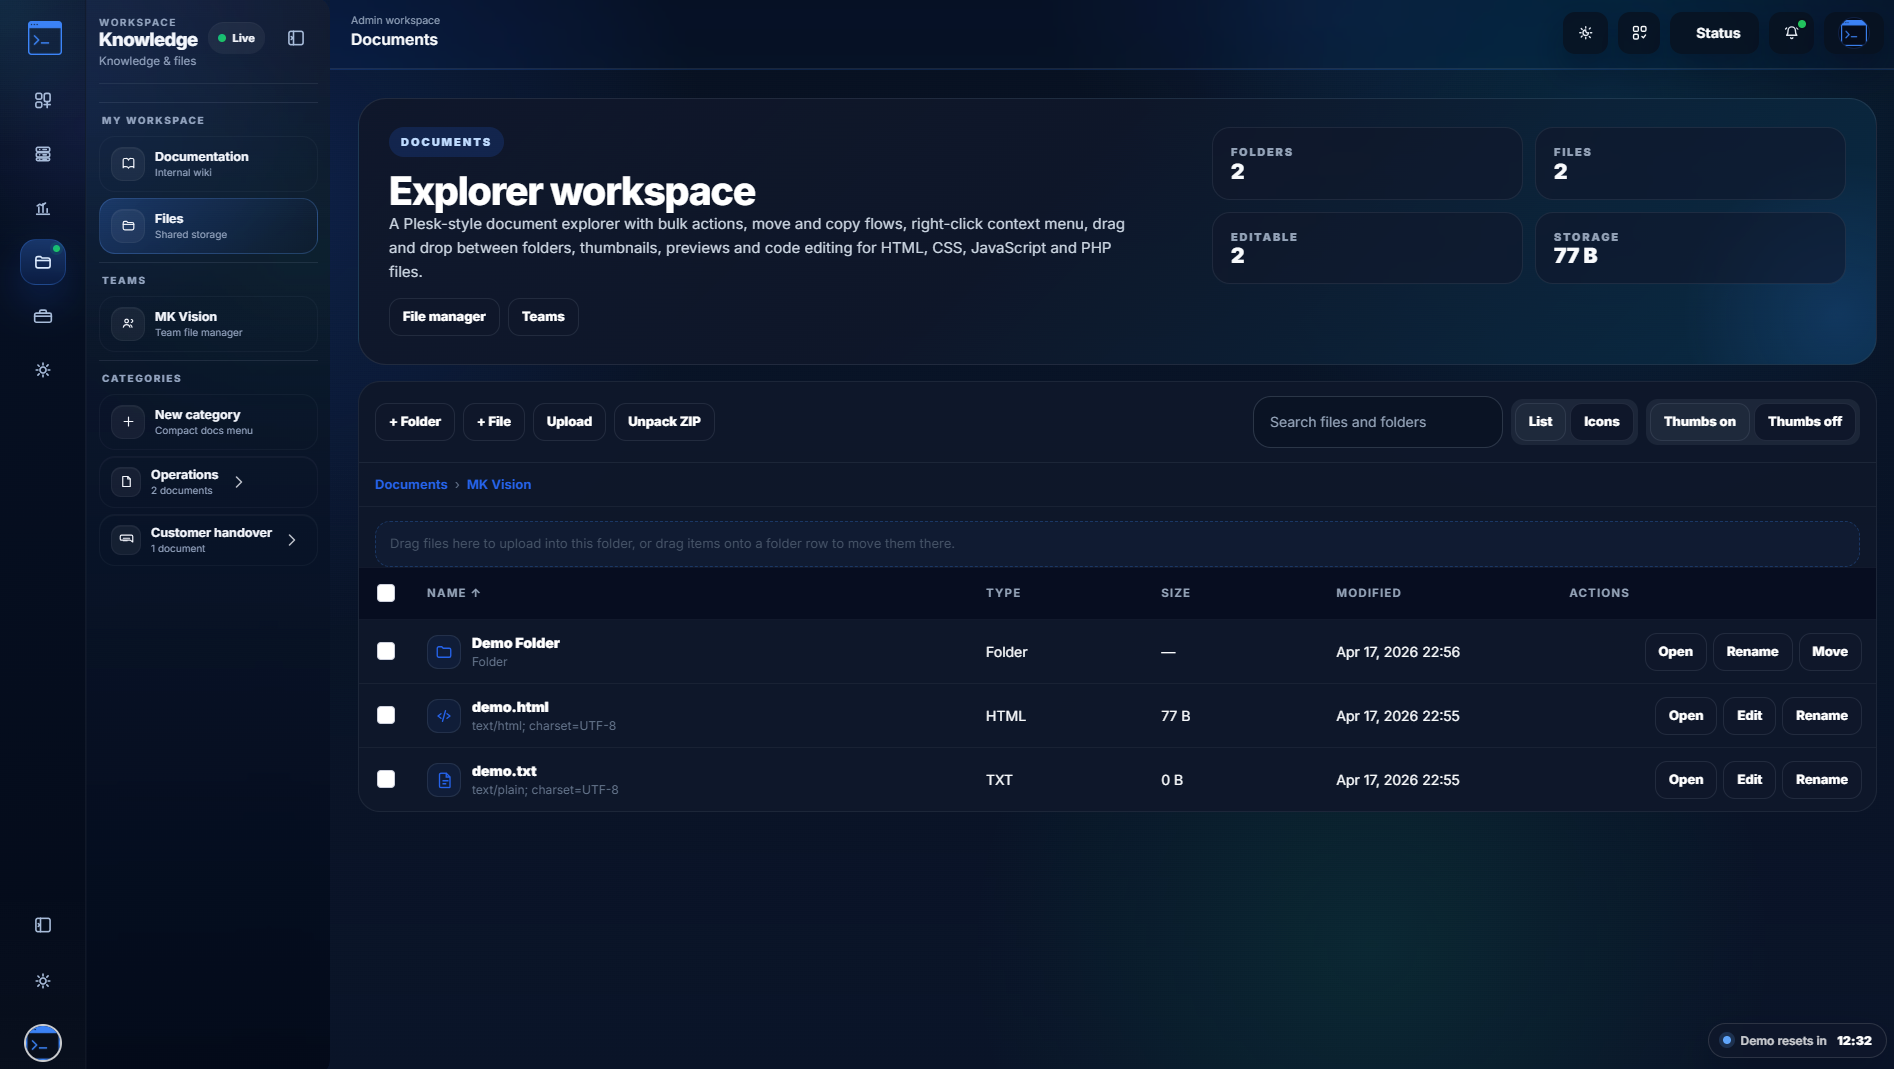
Keep your internal knowledge and file sharing connected to your workflow. Easily create dedicated folders for your team or provide secure access to your clients.
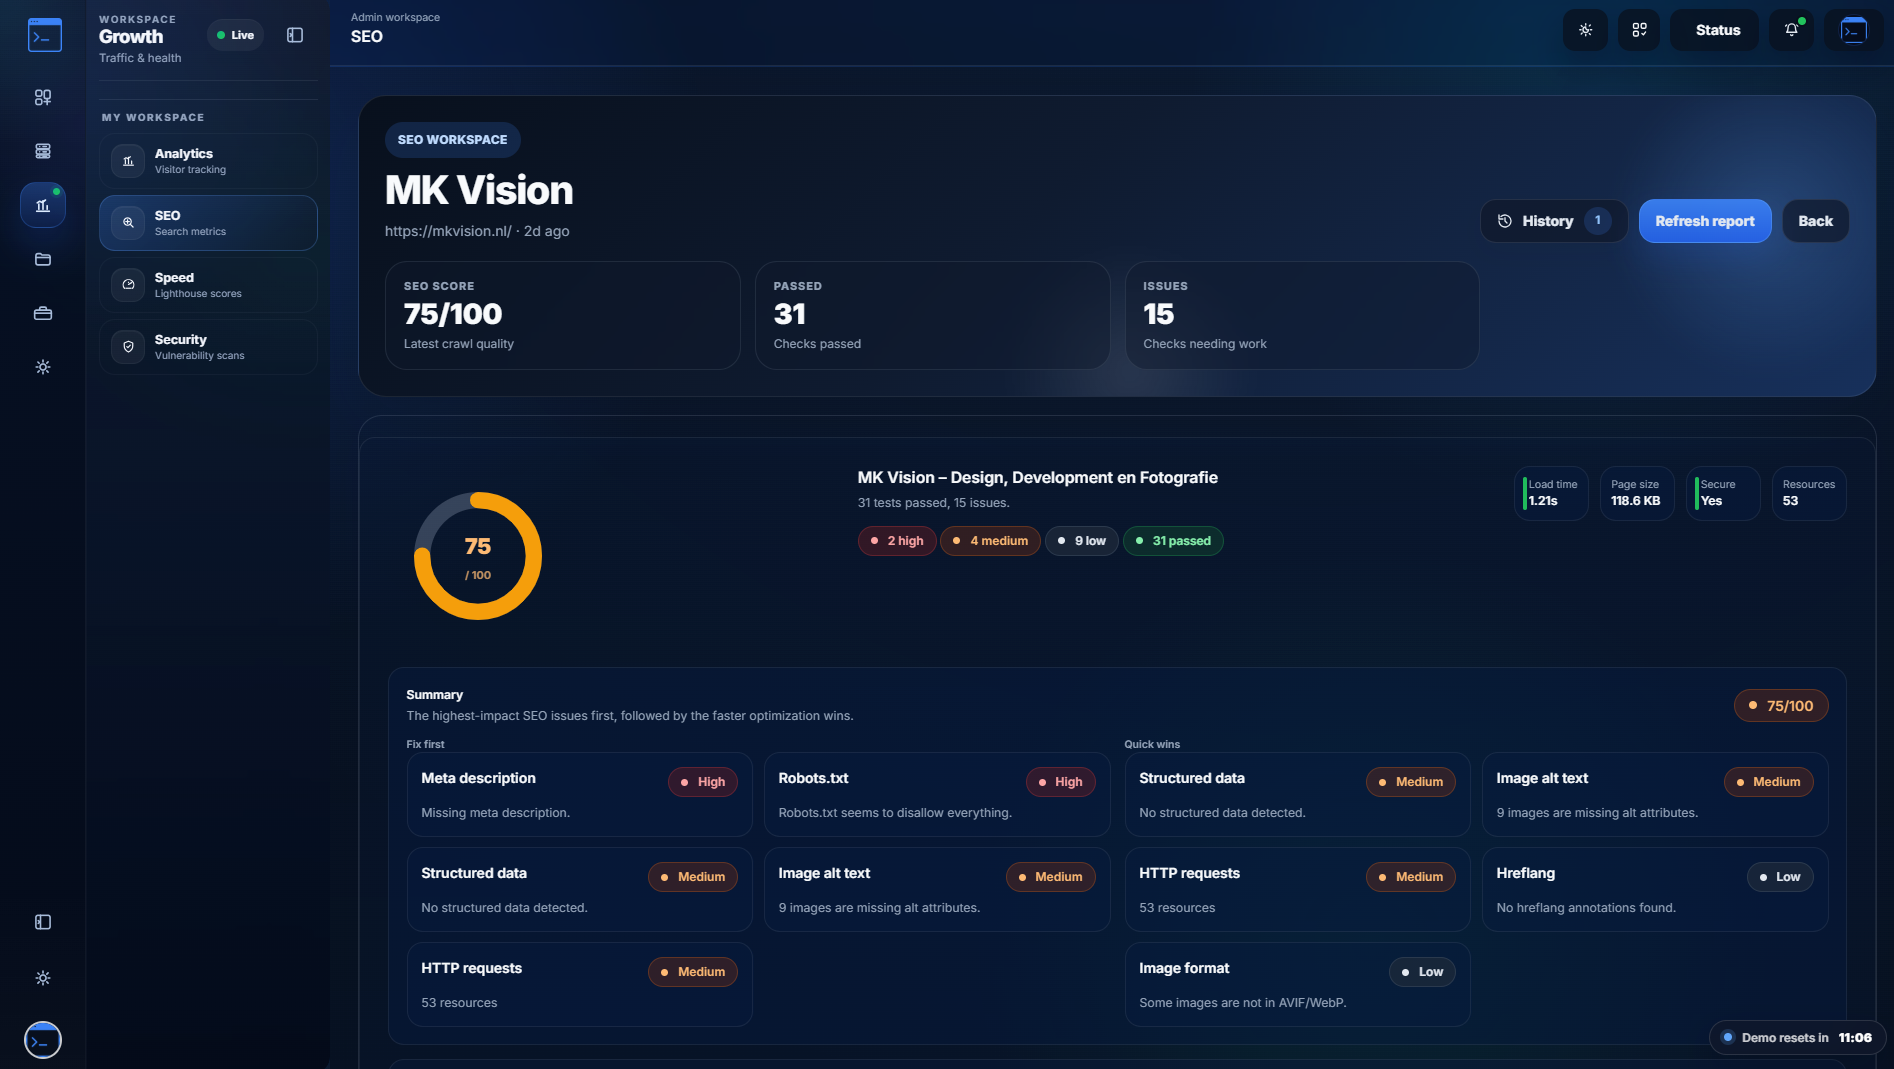
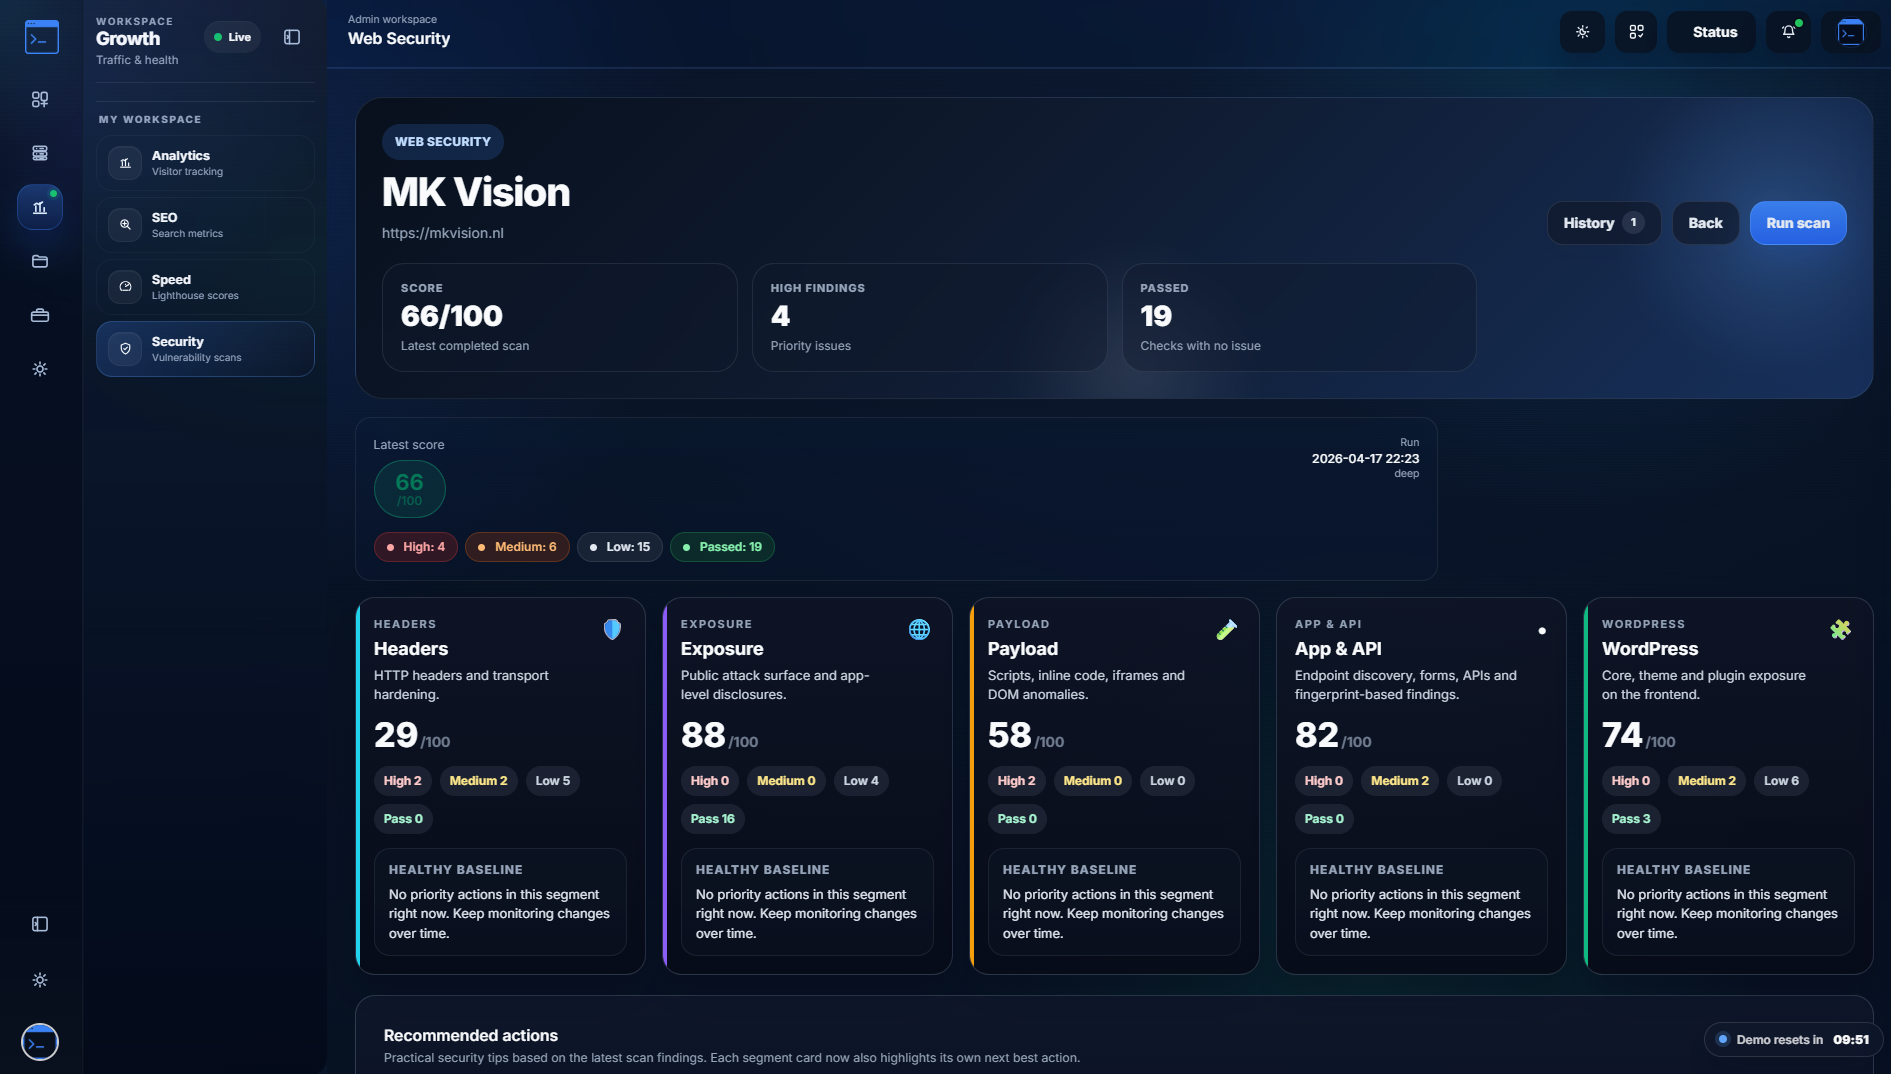
A unified architecture where monitoring alerts, web audits, support tickets, file workspaces, and financial approvals all share the same identity and data structures.
 is intentional.
Every alert flows through a deliberate pipeline — from check to customer, with zero noise and full control.
Website, SSL, ping, and grouped services are monitored on a recurring schedule. Any deviation creates an incident automatically.
Per-monitor or site-wide routing rules determine exactly which channels receive which alerts. Granular control means no alert fatigue.
Internal notifications and the customer-facing public status route run in parallel. Branded templates and webhooks go out simultaneously.
Review incident history and performance metrics to strengthen your infrastructure and prevent future downtime.
Fill out the form below and we'll set up your license within 24 hours.
No. Monitoring is a core part of the platform, but it also includes status communication, server visibility, analytics, ticketing, quotes, projects and documentation.
Yes. You can control branding, titles, visible sections and styling so it fits your own environment.
Yes. The platform is designed for internal operational workflows as well as external customer access for status, tickets and quotes.
Yes. The portal is built to work across mixed environments seamlessly.
Yes. It can be used with demo data and resettable demo environments, which makes it useful for presentations and onboarding.
Yes. Secure access links or codes can be used for selected customer-facing flows.